
New Zealand OIA request reveals the COVID vaccines increased your risk of dying
Chris Johnston submitted a OIA request to the New Zealand health authorities. The official response shows that the vaccines didn't protect people from COVID. It killed them.
Executive summary
New Zealand resident Chris Johnston submitted an OIA request (similar to a FOIA) to the New Zealand health officials.
I analyze the results in this article.
Short story: The data they returned shows that the COVID vaccines didn’t save anyone from dying from COVID. They did the opposite: they increased mortality. Even worse, when COVID deaths peaked in July 2022, the vaccinated were disproportionately affected.
In short, they lied. Their own data shows that if you followed their advice, it was more likely you’d die during a COVID outbreak.
Are you surprised?
The data
You can download the source data from the public link.
I’ve downloaded the data, changed the numbers to numbers, did a pivot table analysis on the data, and posted it all to the New Zealand repository in this folder:
data-transparency\New Zealand\FOIA responses\vaxxed vs unvaxxed deathsTheir analysis of the data released under OIA
I’m not aware of any respected epidemiologist who has published an analysis of that data showing that the COVID vaccines are safe and effective.
Odd. I wonder why? There must be a reason!!!
This is, for now, the gold-standard data on mortality of the vaccinated vs. unvaccinated because the NZ health authorities won’t release the record level data so this is the best we have.
It’s not as good as the record level data that New Zealand released earlier, but it’s not bad and we can draw some important conclusions from the data.
You’d think that the epidemiologists worldwide would be all over this data. And all the trolls on X who claim to be expert in statistics would be all over it as well.
But there is not an analysis in sight! Just hand waving attacks on my post on X that I’m a liar, etc. The usual stuff.
Maybe if we looked at the data ourselves, we might have a clue!
The analysis
Here’s a plot of the data they provided:
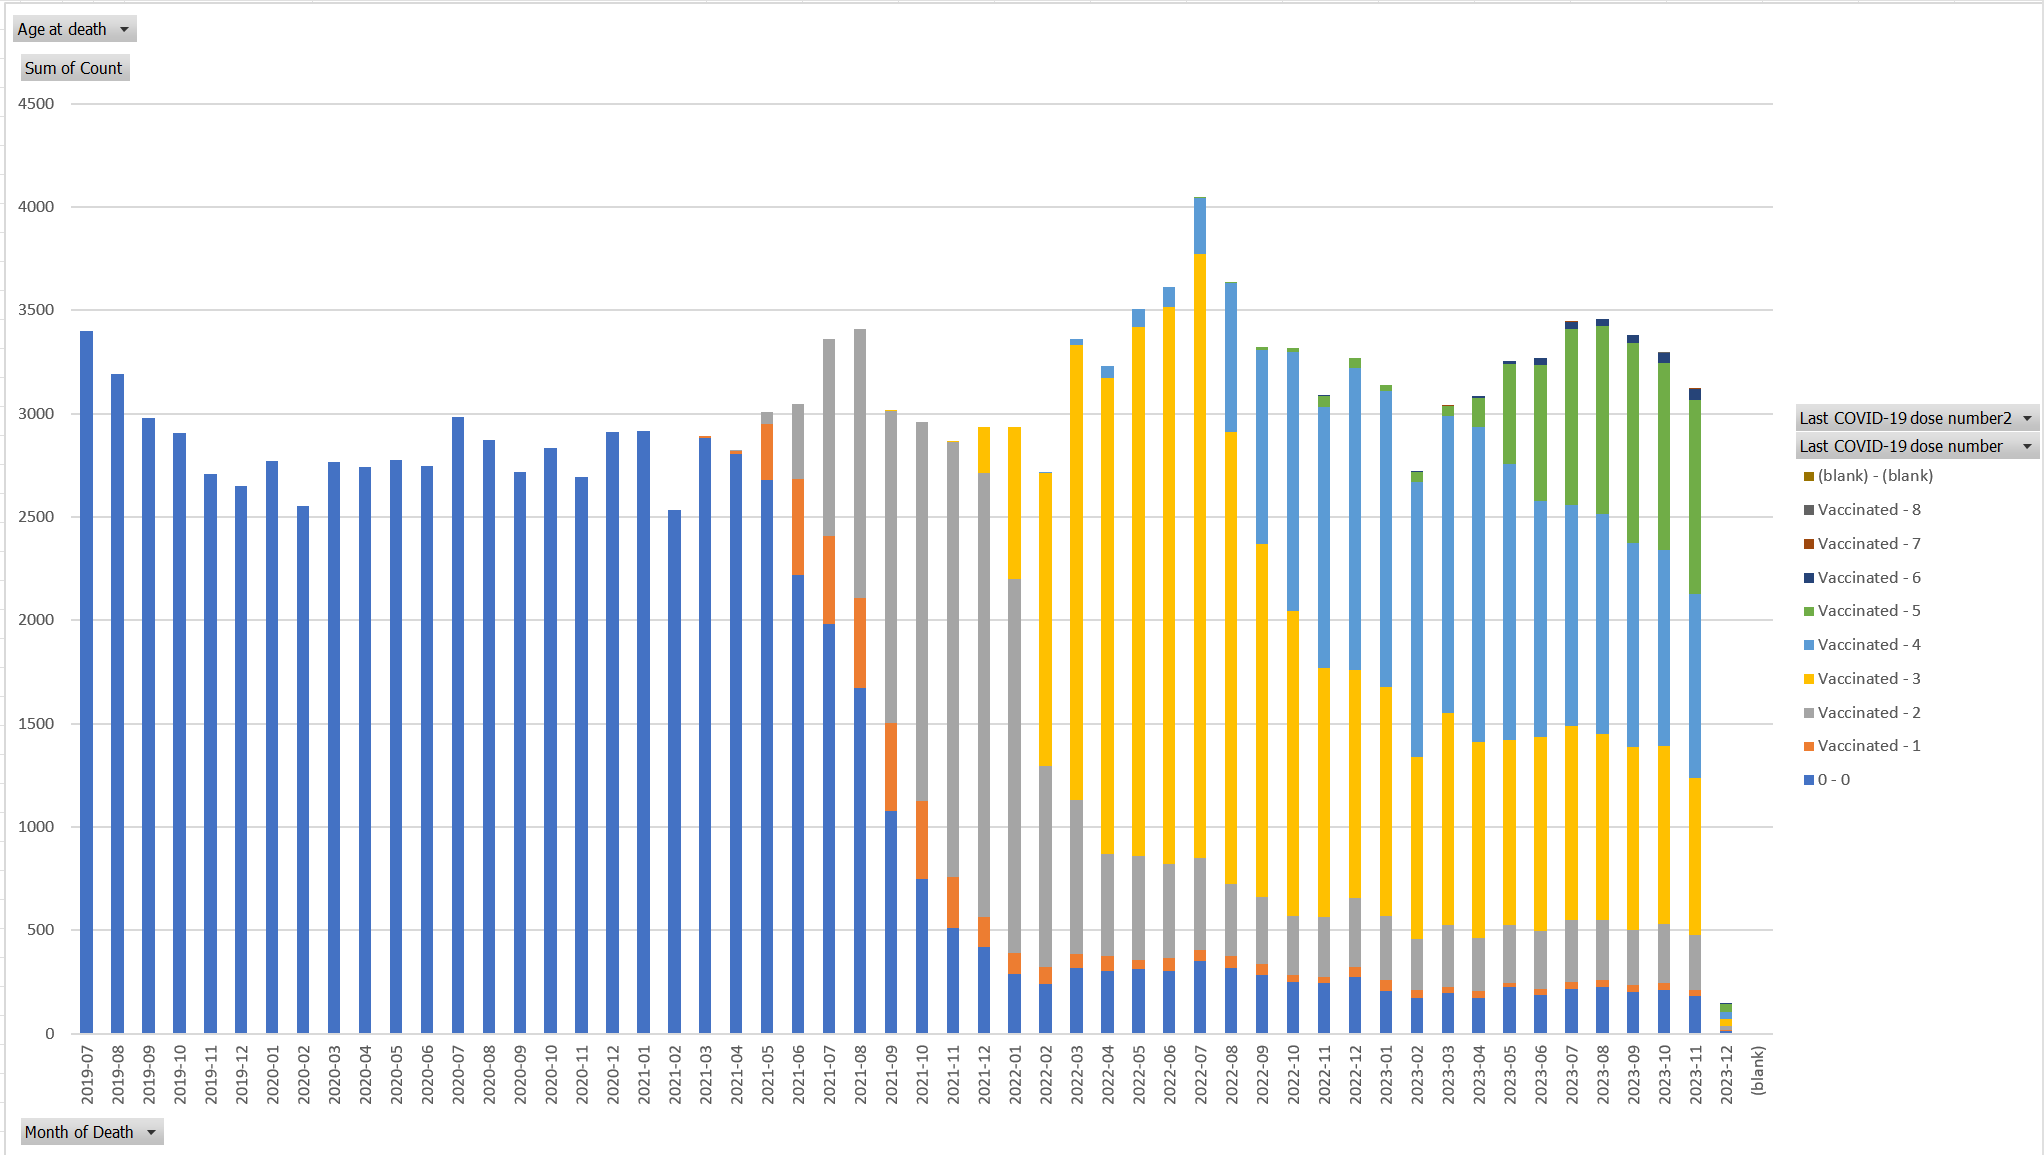
Two things jump out immediately in looking at this graph:
Monthly death tolls hit new highs after the COVID vaccines roll out. These are excess deaths. They started making fresh highs after dose 2 and and after dose 3. Some deaths after March 2022 could be ascribed to COVID, but that’s a bit odd since the death spike is in the vaccinated, not the unvaxxed, and the vaccine is supposed to protect you from dying from COVID. Also, the variant was Omicron which wasn’t very deadly. So if people were vaccinated and died from a mild COVID variant, this should be very alarming to the authorities if they were paying attention.
The deaths for the unvaccinated are relatively flat over time. So the excess deaths in New Zealand clearly was caused by a pandemic of the unvaccinated.
But this interpretation based on the aggregated data could be misleading. For example, suppose that everyone over 40 years old was vaccinated and everyone under 40 was not vaccinated. The differential in death rates could be due to the mix of ages in the two groups.
So to account for that we can either compute an age-standardized mortality rate for the two groups (which we don’t have the data to do since we don’t know the population sizes) or we can simply age-stratify the graphs. Since we can’t do the former, we’ll do the latter.
Age 81 to 100 analysis
Let’s start with 81 to 100 since that is the range where we have the most deaths so the data will have less statistical noise.
Because I used pivot tables, it’s trivial to use the popup menu in cell H1 to change the age range to 81 to 100. Here’s the new graph restricted to ages 81 to 100.
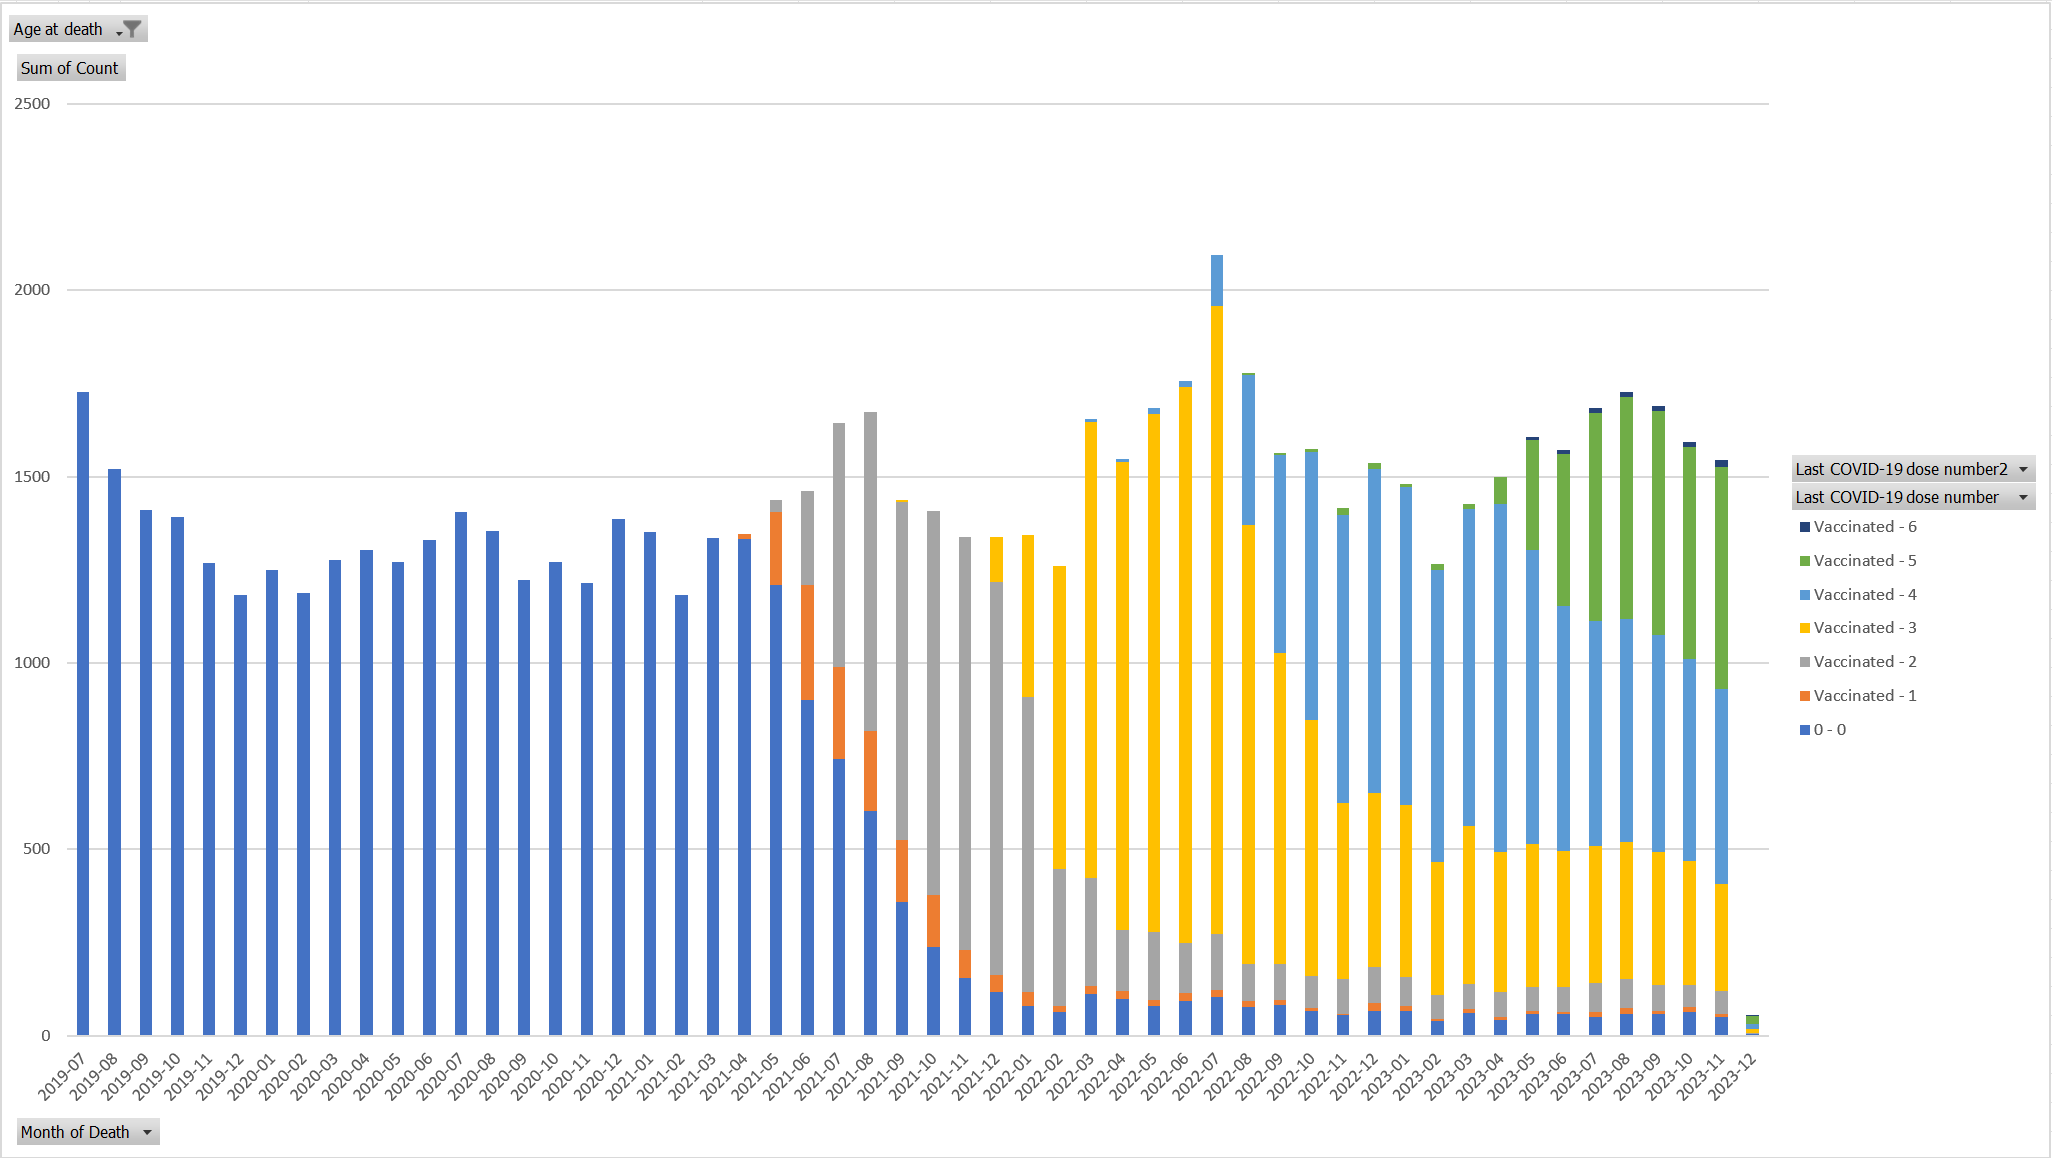
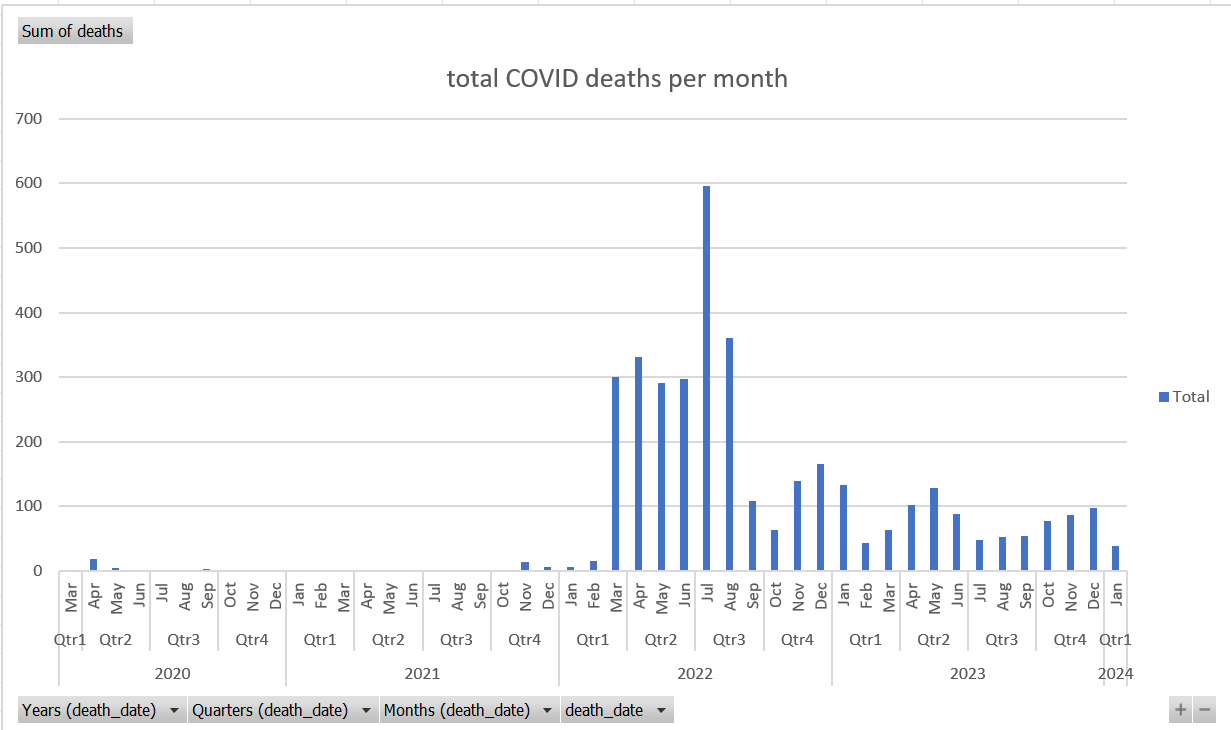
Let’s look at that peak in July 2022. This is when there was a huge COVID outbreak in New Zealand:
So how did the vaccinated vs. unvaccinated fare? The spreadsheet tells us:
If you were unvaxxed, the death count went from 94 to 103. If you were vaxxed, the death count went from 1662 to 1992 during “peak COVID.”
If the vaccine protects people, the increase will be smaller for the vaccinated.
One little problem: it’s not!
Here is the calculation:
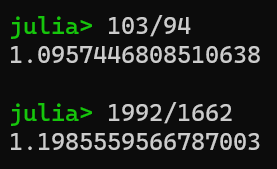
So there you go. If you got the shots, your mortality skyrocketed during peak COVID.
The vaccine didn’t reduce your risk of dying from COVID. It increased your risk.
It was a simple sign error!
There is no need to look further. This was the big test and the vaccines failed.
This is why no mainstream epidemiologist is ever going anywhere near this data.
You’ll only see the analysis from “misinformation spreaders” such as myself.
The gaslighting attempts
They’ll try to gaslight you into believing that the mortality was higher in the vaccinated because the healthy people avoided vaccination and chose not to participate in New Zealand society. Right. Sure. The data Barry Young released shows the opposite: it was the healthier people who opted for the shots. This makes the disparity even more troubling.
Of course, we’ll never get a chance to discuss this publicly in an open debate because nobody will show up.
Summary
The reason mainstream epidemiologists are avoiding the latest New Zealand data drop from the health authorities is that it shows the vaccines increased your risk of dying from COVID.
So these epidemiologists stay silent and refuse to be questioned or participate in any public discussions about the data.
That’s how science works!


No comments:
Post a Comment